Digital Rails is a system where autonomous vehicles would travel in platoons on exclusive lanes, achieving high efficiency through synchronization with traffic signals. The idea for Digital Rails (DR) began at Questtonó, a Brazilian innovation and design consultancy.
Digital Rails presents three main pillars:
The Figure bellow, extracted from Questtonó’s website, presents a concept-art for the project. The rationale for the project is to offer an alternative for urban transportation during the period while the autonomous vehicle fleet is growing, allowing AVs to share the roads with regular vehicles. For vehicles using the system, the travel time would be reduced, since there would be no stops due to traffic signals or traffic jams.

We selected a region spanning a large portion of what is called the expanded downtown (centro expandido) of São Paulo, on which CET applies restriction of vehicle traffic during peak hours, based on their license plates. The next figure shows the region that we selected, represented on OpenStreetMap. The region consist in a box between latitudes -23.5054 and -23.6327, and between longitudes -46.7566 and -46.5707. It has a daily traffic magnitude of hundreds of thousands vehicles.
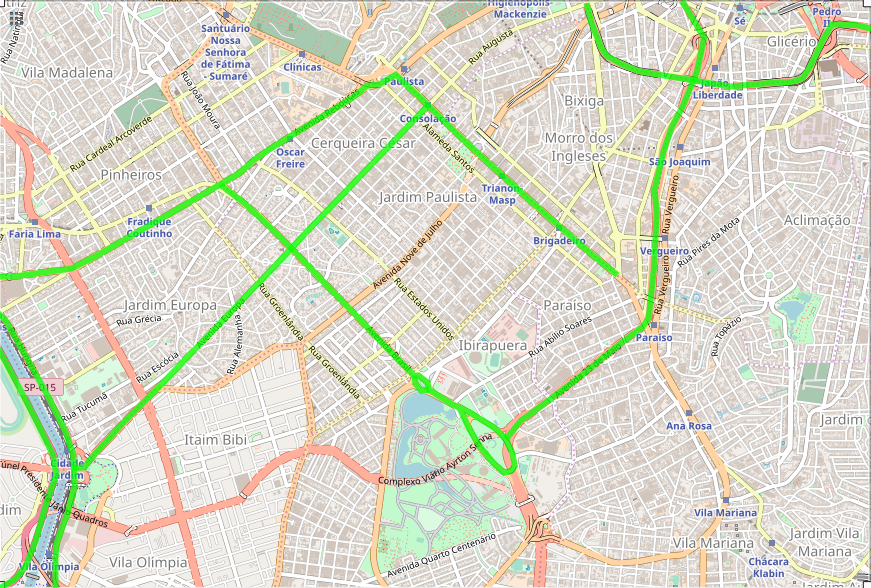
We then proceeded to enumerate candidate arterial roads to host DR lanes inside the selected region. The main criteria used was the total traffic volume, as reported by CET. The rationale was that implementing DR lanes in the roads with the most volume should maximize the impact of the system. From the two most recent reports, we selected the following routes:
The map below shows the selected region with the routes highlighted in green. The next step was to generate realistic traffic input for simulation scenarios in the selected region. The starting point were the mobility trace of the city of São Paulo . We generated this dataset using the InterSCSimulator by running the traffic of the city of São Paulo for a whole day. From this trace, we isolated all vehicle that passed by the selected region at some point of the day. For each of these vehicles, we defined its trip starting and destinations points as the locations of its first and last appearance inside the region, respectively. This procedure yield an input file with more than 400k trips defined.
As with the scenario with travels on Avenida Paulista, the travel time decreases when the ratio of vehicles able to use DR increases. It is noteworthy that a ratio of 25%, for example, does not mean that 25% of vehicles actually used DR. Instead, it indicates that 25% of vehicles were able to use DR and used the system whenever they went to a road with an assigned DR lane. We highlight the following results:
In conclusion, the simulated scenarios for DR in multiple arterial ways also present significant reductions in travel times, although less dramatic than the simpler scenarios on Avenida Paulista. This is not unexpected, since the paths of the simulated trips are not always within a road with a DR lane.