This partnership connects data analysis and visualization with real Brazilian healthcare problems in order to promote evidence-based public policies in our country. We especially thank Rudi Rocha, Beatriz Rache and Marcela Camargo for their special effort to contribute to these projects.
The current page contains projects related to the health area, involving articles, presentations, and dashboards to consultation and clear visualization for professionals in the area or researchers. Such projects aim to facilitate data visualization from the health area, especially with the dashboards.
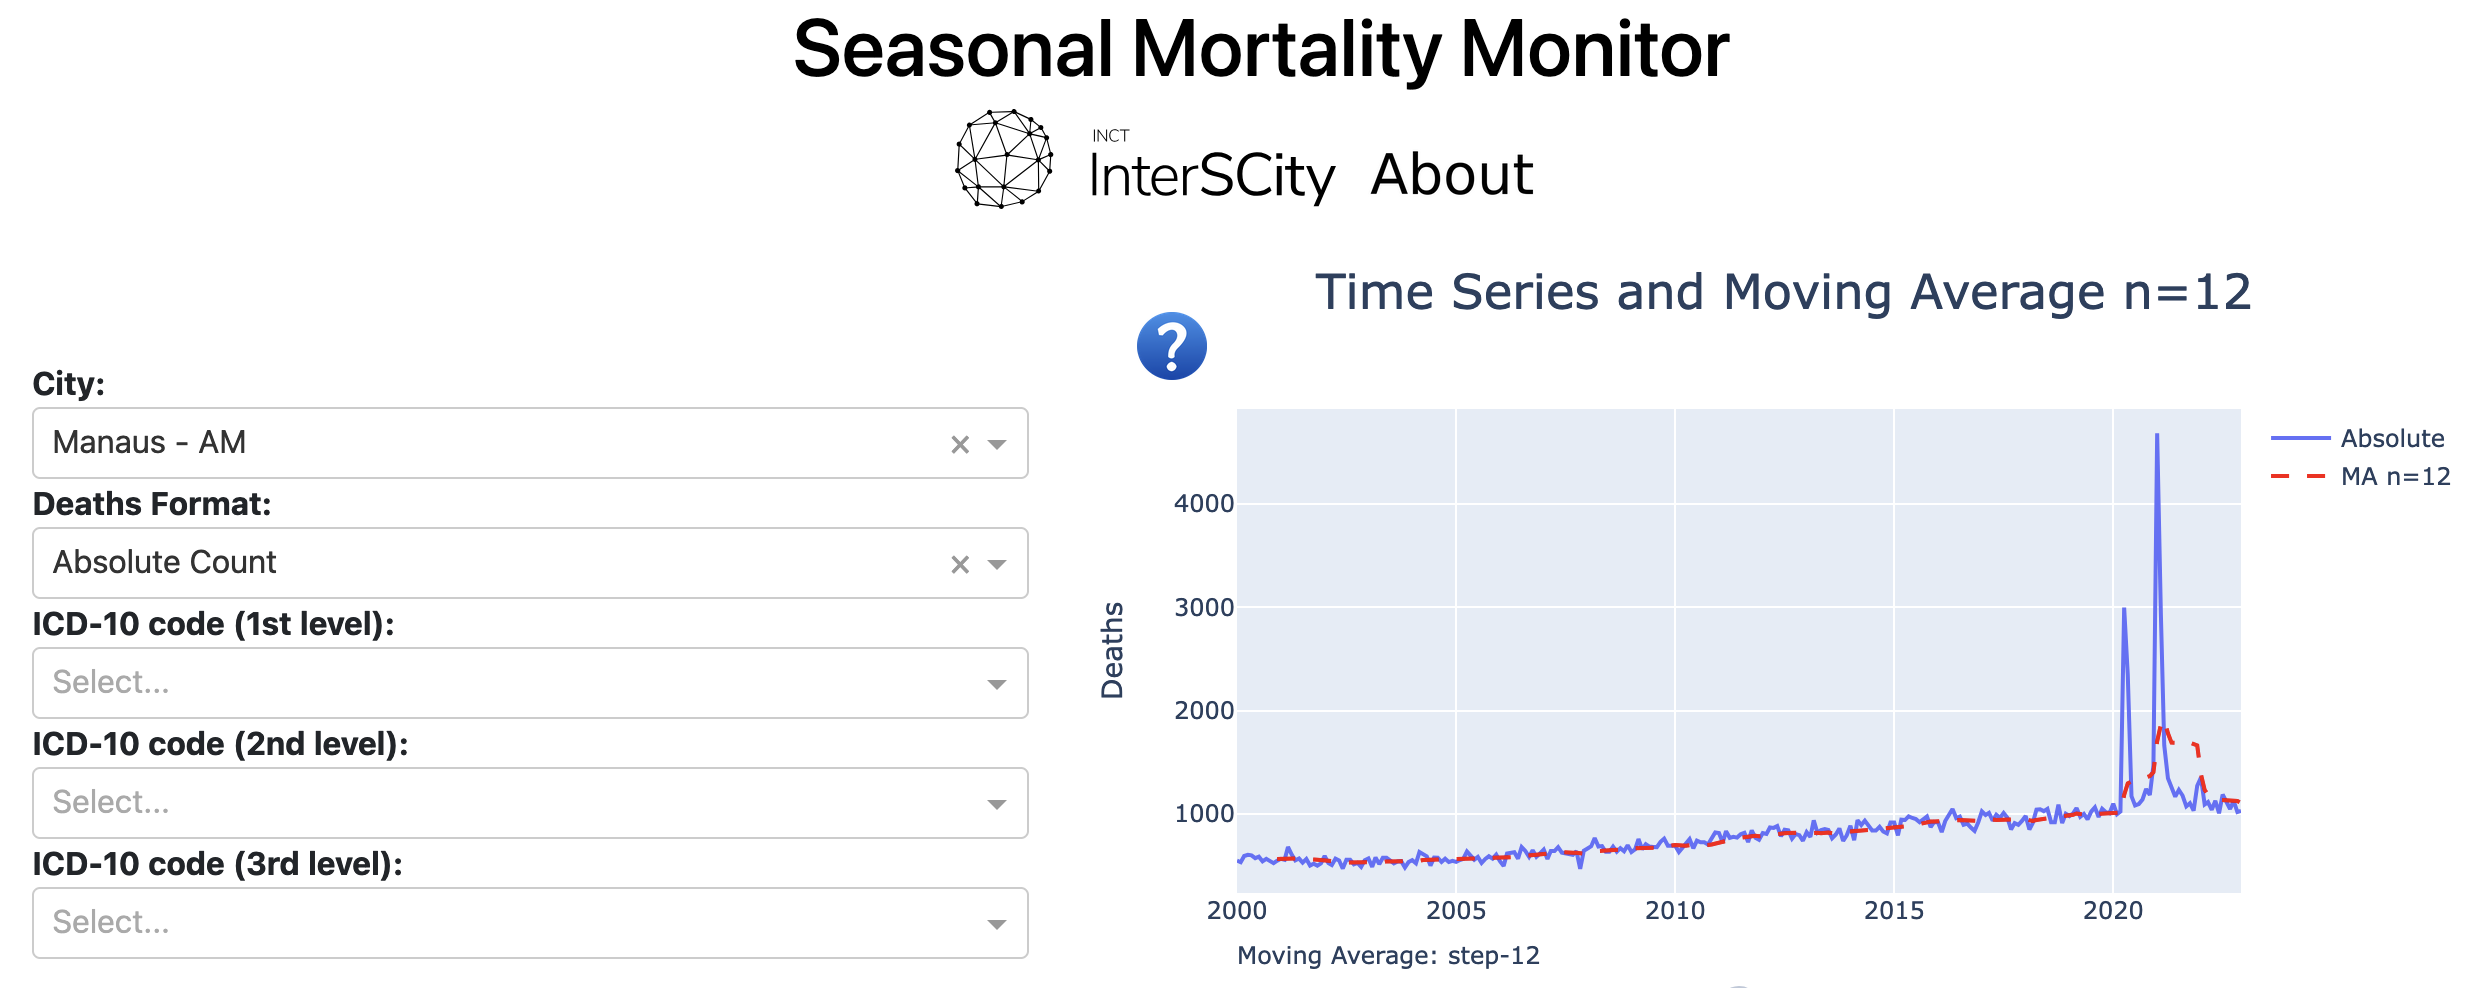
Understanding the distribution of mortality and its influencing factors is essential to guide healthcare policies. Studies have found a seasonal variation in mortality with excess winter deaths in many countries, though not universally. Researchers suggest that climate and socioeconomic factors influence these patterns, but the exact mechanisms remain unclear. Despite Brazil’s diverse climate and sociodemographic landscape, along with a comprehensive healthcare database providing an ideal setting for such studies, large-scale research within the country still needs to be done. To address this gap, we analyzed mortality data across the nation. We identified three distinct seasonal mortality patterns using various metrics, including our novel Excess Death index (EDi), a robust alternative to the limited Excess Winter Deaths index (EWDi). Our findings also suggest that Dew Point Temperature, which integrates the effects of temperature and humidity, is the critical climate factor influencing mortality. Additionally, we developed an interactive dashboard that enables exploring the details of the mortality patterns of specific causes of death across the country, expanding the accessibility and applicability of our findings. This tool provides insights into both the seasonality and the sociodemographic factors of mortality. Notably, it shows that black, brown, and indigenous men die earlier than other demographics, though further analysis shows that these disparities are diminishing over time.
The HealthDashboard project, based on advanced Computer Science technologies (Big Data, Data Visualization, and Data Science), is an innovative visualization and decision-making support tool for health professionals and public managers. It is an interactive visual dashboard for large-scale data analysis based on the Brazilian National Health System (SUS) hospitalization data. Its software architecture enables integration with the Hospital Information System (SIH-SUS) datasets from any region of Brazil so that health professionals can use it in hundreds of different cities. It processes SIH-SUS data and stores it into a geolocated relational database. Expert users can then perform advanced queries on the data with composite filters. Results are then displayed via multiple map visualizations, graphs, and tables. The goal is that this open-source platform will become a useful tool for science-based public health policymaking, influencing Brazilian public managers in the future to adopt an evidence-based, data-driven approach to healthcare management.
Abstract:
Seasonal infectious diseases, such as dengue, have been causing great losses in many countries around the world in terms of deaths, quality of life, and economic burden. In Brazil, this is relevant not only in large cities such as Rio de Janeiro and Sao Paulo but, according to the Ministry of Health, in another ˜ 500 cities throughout the country. Predicting the occurrence of diseases, such as dengue bursts, can be a valuable instrument for public health management as health officials can better prepare and redirect resources to the affected areas. In this paper, we present an explainable machine learning model to forecast the number of dengue occurrences in a large metropolis, Rio de Janeiro. We focus on explainable models, which provide health authorities with the reasons for outbreak predictions, allowing them to plan their actions accordingly. We trained a gradient boosting decision tree algorithm (CatBoost) with data from the National System of Information on Notifiable Diseases (SINAN), weather data, and socio-demographic data from The Brazilian Institute of Geography and Statistics (IBGE).
Abstract:
New studies in the field of epidemiology are constantly emerging, bringing significant contributions to the context of public health. There are studies that look into the geographic distribution of specific diseases in particular regions, but very few studies investigate the similarity of the geographic distribution of different diseases. This lack of research reflects a lack of knowledge on how to create specific territory-based public policies for different disease groups. This work aims to study, through the use of spatial statistical analysis and machine learning, which diseases causing deaths in the city of São Paulo have similar geographic distributions. Our contribution is twofold: defining a new methodology for identifying which groups of diseases have similar behaviors in relation to their geographic distributions of deaths and also providing a case study for the city of São Paulo. The major findings were that higher mortality rates associated with neoplasms are concentrated in the central region of the city, while higher mortality rates associated with circulatory system diseases are concentrated in the periphery. This shows that, in regions with better socio-economic conditions, the population dies from inevitable causes that have no cure, as they receive good care for the other causes. On the other hand, the population in a more vulnerable situation dies earlier from a cause that has a cure and prevention, but these regions have greater precariousness in accessing health services. As for endocrine, nutritional, and metabolic diseases, a portion of the central and western regions have slightly lower mortality rates than other regions. These are diseases that are prevented with good nutrition and physical activity, which the higher-income population can obtain more easily. However, for nervous system diseases, these regions have higher rates than other areas. Future work may provide justifications for this behavior to support the development of new health policies.
Abstract:
The Internet of Things (IoT) aims to connect the physical world and the Internet, which opens up the possibility of developing various applications, especially in the health sector. These applications require a large number of sensors to collect information continuously, generating large streams of data that are often excessive, redundant or meaningless to the system’s operations. This massive generation of sensor data wastes computing resources to acquire, transmit, store and process information, leading to a loss of efficiency in these systems over time. In addition, IoT devices are designed to be small and portable, powered by batteries, for greater mobility and minimized interference in the monitored environment. However, this design also results in energy consumption restrictions, making battery life a significant challenge that needs to be addressed. In addition, these systems often operate in unpredictable environments, which can generate redundant and insignificant alarms, rendering them ineffective. However, a self-adaptive system that identifies and predicts imminent risks through an early warning scoring system (EWS) can deal with these problems. Due to its low processing cost, the EWS reference can be incorporated into wearable devices and sensors, allowing better management of sampling rates, transmissions, alarm production and energy consumption. Following the above idea, this thesis presents a solution that combines an EWS system with a self-adaptive algorithm in IoT patient monitoring applications. In this way, promoting a reduction in data acquisition and transmission, reducing non-actionable alarms and providing energy savings for these devices. In addition, we have designed and developed a hardware prototype capable of shipping our proposal, demonstrating its technical feasibility. In addition, using our prototype, we collected real energy consumption data from the hardware components that were used during our simulations with real patient data from public databases.
Our experiments showed great benefits with this approach, reducing the data sampled by 87 percent, the total load of messages transmitted from the monitoring device by 99 percent, 78 percent of alarms and energy savings of almost 82 percent.In conclusion, this work presents an approach for the more efficient use of computing, communication and energy resources to implement IoT-based patient monitoring applications.
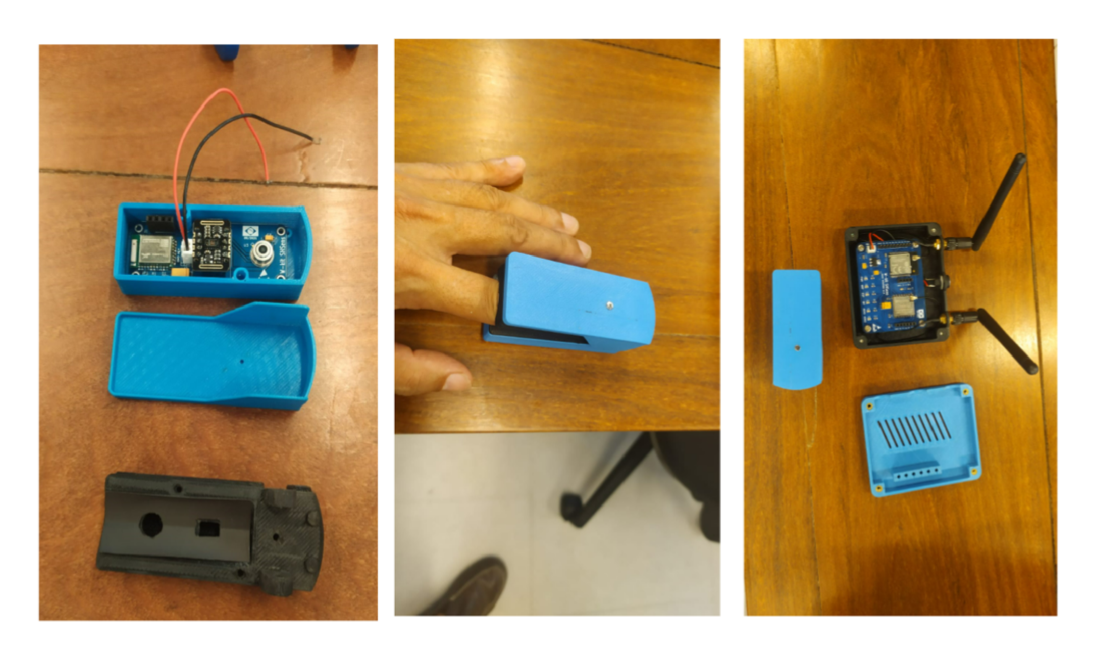
Images of our SH-Sens WKit prototype and base station. The wearable device is a finger clip.
Related papers:
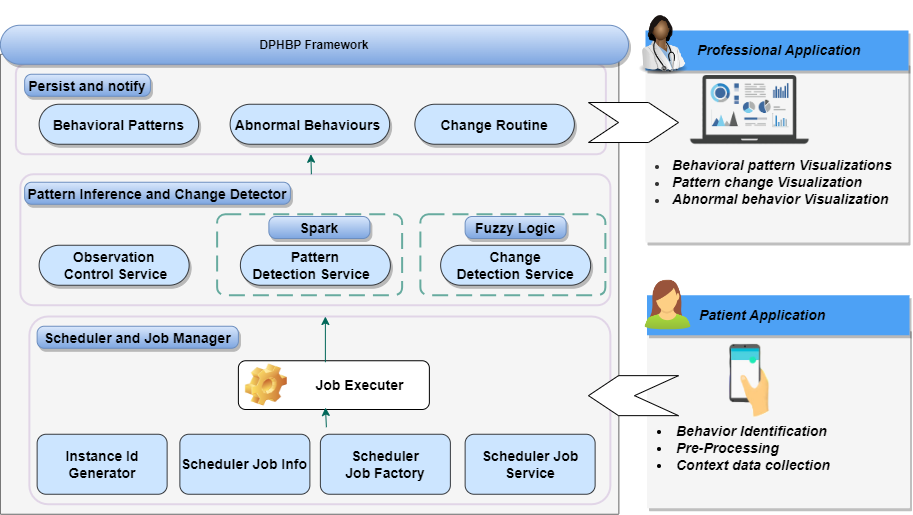
Digital phenotyping refers to the automatic collection of context data from sensors connected/embedded in personal devices, transforming this data into objective information about human behavioral dimensions, such as sociability and mobility. In this work, we developed a solution called Digital Phenotyping of Human Behavior Patterns Framework (DPHBP Framework) to support professionals specialized in different areas of healthcare (e.g. mental and psychological health, chronic diseases) in monitoring their patients. Specifically, this solution implements an algorithm that detects human behavior patterns by processing behavioral events inferred from context data. We explored the approach called Frequent Pattern Mining (FPM) to develop the proposed algorithm, making it possible to recognize time intervals in which individuals routinely repeat behaviors based on context attributes. Furthermore, using fuzzy logic concepts, the DPHBP Framework implements an approach to detect patterns changes and abnormal behaviors. For the distribution of behavioral events inferred through wearable and smartphone sensors data, we also conceived a process to incorporate QoC requirements in digital phenotyping applications, based in five steps: (i) QoC requirements specification, using a defined metamodel; (ii) automatic generation of target code, through a transformation mechanism that receives the requirements as input; (iii) incorporation in the digital phenotyping application of the generated source codes; (iv) evaluation and monitoring of QoC parameters during application execution; (iv) visualization of the monitoring data through Dashboards, providing the developer with an environment in which it is possible to monitor the quality level of the application instances.
Related papers: